
When AWS Glue Jobs Quietly Burn $22k a Month
A Spark + Iceberg story about DPUs, partitions, and one tiny data type choice

Cloud costs don’t always explode because of scale.
Sometimes they explode because of details.
This is a story about a few AWS Glue jobs, Apache Iceberg, and how a single query pattern quietly pushed our Glue spend to $22k in a month days, without anyone noticing at first.
Nothing was broken. Data was flowing.
And yet, money was leaking fast.
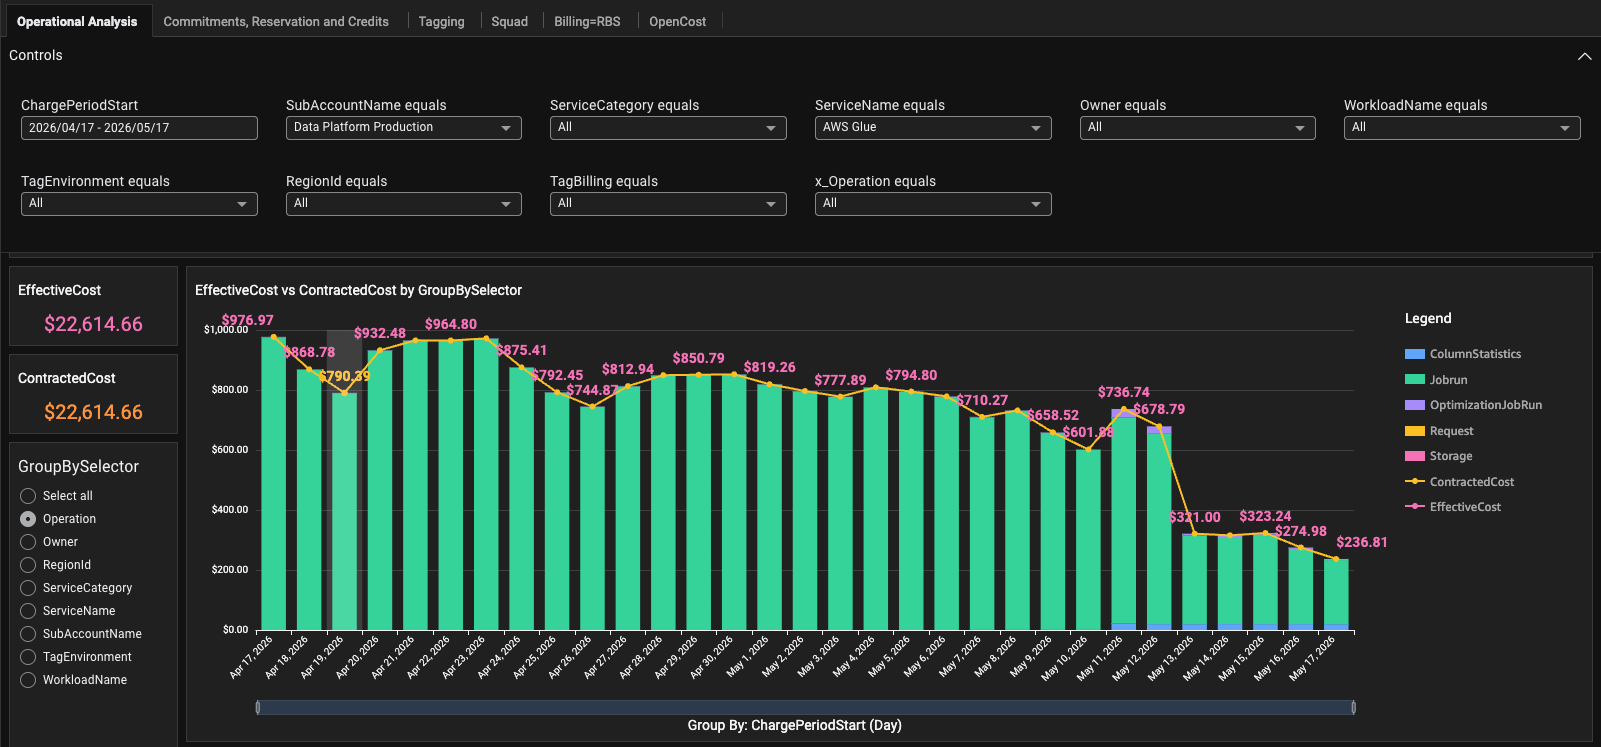
The Symptom: $22k MTD in AWS Glue
At first glance, the number alone didn’t tell us much:
Glue spend (MTD, 23 days): ~$22,000
No alerts. No failures.
Just… cost.
So we did what any FinOps forensic investigation starts with: job-by-job attribution.
Low-Hanging Fruit: DPUs Don’t Mean Performance
The first win was almost boring, and that’s the point.
Job: append_to_iceberg_table
Cost: ~$6k/month
Configuration: 4 × G.1X executors → 4 DPUs
Runtime: 1–2 minutes per run
After checking metrics and enabling Spark UI briefly, it was obvious.
This job was over-provisioned. We cut it to 2 × G.1X (2 DPUs).
Same runtime. Same output.
~50% cost reduction.
A reminder: more DPUs rarely equal faster jobs.
The Real Culprit: A Merge Job That Looked “Normal”
Then we hit the expensive one.
Job: ter_merge_job
8 × G.4X workers → 32 DPUs
Runtime: ~25 minutes
Cost: ~$5k MTD
Scheduled “every 7 minutes” (which was impossible with max concurrency = 1)
This one deserved a deeper look.
So we enabled Spark UI and Job metrics.
What we saw immediately raised red flags 🚩
The Smoking Gun: 162 GB of Shuffle
Two stages stood out:
Stage 12 → 162 GB shuffle write
Stage 14 → 14.6 minutes
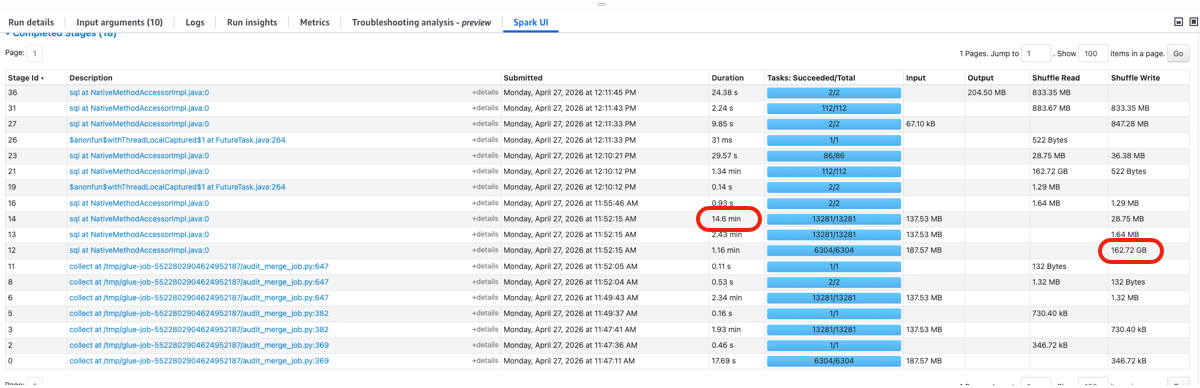
Both mapped back to a MERGE INTO query against Apache Iceberg tables.
Digging into Spark SQL / DataFrame metrics:
One table scan returned ~3.3B rows
Another scan returned ~5.9B rows
After filtering?
👉 ~29,000 rows
That’s not inefficient. That’s catastrophic!
“But the Table Is Partitioned…”
The table was partitioned, yes, by created_at.
And the query looked reasonable:
audit_created_at >= TIMESTAMP '{main_max_audit_created_at}'
AND audit_created_at <  TIMESTAMP '{audit_max_audit_created_at}'
So why was Spark scanning every single row?
To answer that, we stripped the job down.
Reproducing the Problem (On Purpose)
We cloned the job and ran isolated queries to test partition pruning behavior.
Same table.
Same data.
Different WHERE clauses.
The results were… unsettling.
Query 1: CAST to DATE (works)
WHERE CAST(created_at AS DATE) >= DATE '2026-04-26'
  AND CAST(created_at AS DATE) <  DATE '2026-04-28'
  AND created_at >= TIMESTAMP '2026-04-26 11:00:00'
  AND created_at <  TIMESTAMP '2026-04-27 07:00:00'
✅ Partition pruning
⏱ ~28 seconds
📉 Millions of rows scanned
Query 2: DATE only (works)
WHERE CAST(created_at AS DATE) >= DATE '2026-04-26'
  AND CAST(created_at AS DATE) <  DATE '2026-04-28'
✅ Partition pruning
⏱ ~28 seconds
Query 3: TIMESTAMP (disaster!)
WHERE created_at >= TIMESTAMP '2026-04-26 11:00:00'
  AND created_at <  TIMESTAMP '2026-04-27 07:00:00'
❌ No partition pruning
🤯 ~5.6 billion rows scanned
⏱ ~15 minutes
Same data.
Same logical filter.
Wildly different cost.
The Root Cause: TIMESTAMP vs TIMESTAMP_NTZ
The key detail was hiding in plain sight.
created_atin Iceberg was defined as TimestampType (microsecond precision, no timezone)Spark queries were using TIMESTAMP
Spark couldn’t push the predicate → no partition pruning
When we rewrote the query using TIMESTAMP_NTZ:
WHERE created_at >= TIMESTAMP_NTZ '2026-04-26 00:00:00'
  AND created_at <  TIMESTAMP_NTZ '2026-04-28 00:00:00'
Suddenly:
Filters appeared in the BatchScan
Partition pruning kicked in
Runtime dropped from 15 minutes → 30 seconds
Rows scanned dropped from billions to hundreds of thousands, which had a great impact on the cost of
S3:GetObject
Same logic.
Different type.
Orders of magnitude difference.
The FinOps Lesson (Not a Spark One)
This wasn’t a Glue problem or an Iceberg problem.
It was a FinOps visibility problem.
A single query pattern multiplied cost
DPUs hid inefficiency
Partitioning existed but wasn’t used
What We Changed
Immediately:
Reduced DPUs where metrics showed overprovisioning
Fixed query filters to use
TIMESTAMP_NTZValidated partition pruning via Spark UI before deploying
Going forward:
Cost anomalies trigger engineering reviews, not just finance checks
Glue cost ≠ job count, it’s query behavior
Final Thought
Cloud cost optimization isn’t about discounts.
It’s about understanding how your systems actually behave.
Sometimes the most expensive thing in your data platform isn’t scale.
It’s a single keyword in a WHERE clause.
🤔 If one of your Glue jobs scanned 5 billion rows today…
Would you know or would you just see the bill tomorrow?